
Benoni Baptist Church is working to plant a conservative, evangelical Baptist church with our healthy DNA in Benoni.
What does the city we’re hoping to reach look like? Unfortunately we’ve still only got access to 2011 census data at Ward level, and will update these stats as soon as new data is published. We have 2022 data at country and metropol level.
South Africa
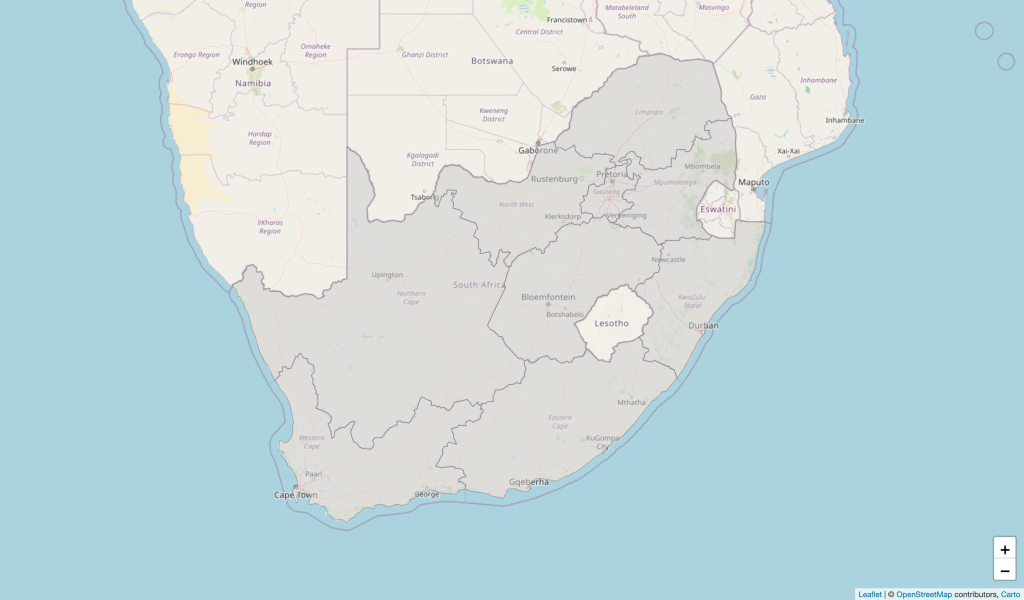
Source: Wazimaps 2026.
Population
- 62,027,503
Source: Wikimap 2022.
The age distribution in South Africa
Age distribution shows how a population is divided across different age groups.
- 0-9: 17.6%
- 10-19: 16.7%
- 20-29: 19%
- 30-39: 17.8%
- 40-49: 17.4%
- 50-59: 8.5%
- 60-69: 6.0%
Source: Wazimap 2022.
Denominational distribution in South Africa
- African Independent Church: 25.4%
- Pentecostalism: 15.2%
- Catholicism: 6.8%
- Methodism: 5.0%
- Calvinism: 4.2%
- Anglicanism: 3.2%
- Other Protestant churches: 5.3%
- Other Christian denominations: 8.4%
- Non-denominational Christianity: 4.5%
Source: Wazimap 2011.
Political party distribution in South Africa
- African National Congress: 39.76%
- Democratic Alliance: 21.79%
- uMkhonto weSizwe: 14.36%
- Economic Freedom Fighters: 9.68%
- Inkatha Freedom Party: 4.09%
Source: https://www.news24.com/news24/elections/map/nnpe?year=2024&level=country.
Voter personas by political party
- African National Congress: Diverse, spanning various demographics, but traditionally includes a significant portion of the black population. They often prioritise social justice, economic equality, and historical redress.
- Democratic Alliance: Often urban, middle to upper-middle class, and values issues such as good governance, economic stability, and individual freedoms. They may be more liberal on social issues.
- Economic Freedom Fighters: Younger, urban, and from lower-income backgrounds. They may be passionate about issues such as economic transformation, land reform, and challenging perceived economic disparities.
- Freedom Front Plus: Afrikaner, conservative, and may prioritise issues such as protecting Afrikaner cultural interests, language, and property rights.
- African Christian Democratic Party: Conservative and places a strong emphasis on Christian values. They may prioritise issues such as morality, family values, and religious freedom.
- United Democratic Movement: Looking for alternatives to the dominant parties and could prioritise issues related to good governance, transparency, and accountability.
- Action South Africa: Frustrated with the existing political landscape and seeking a fresh, centrist approach to governance, potentially focusing on service delivery and anti-corruption issues.
- Congress of the People: Disillusioned with the ANC and looking for a moderate alternative. They might prioritise good governance, constitutionalism, and political stability.
Source: Mark Penrith.
Why people use the internet in South Africa
- Finding information: 82.9%
- Researching how to do things: 76.8%
- Staying in touch with friends and family: 72.0%
- Finding new ideas or inspiration: 70.1%
- Researching products and brands: 69.4%
- Keeping up to date with news and events: 68.9%
- Education and study-related purposes: 65.1%
- Watching videos, TV shows, or movies: 61.0%
- Accessing and listening to music: 55.8%
Social media platforms in South Africa
- WhatsApp: 93.3%
- Facebook: 87.2%
- Instagram: 70.5%
- Tiktok: 69.9%
- FB Messenger: 63.3%
- Twitter: 60.3%
- LinkedIn: 47.6%
Ekurhuleni Metro
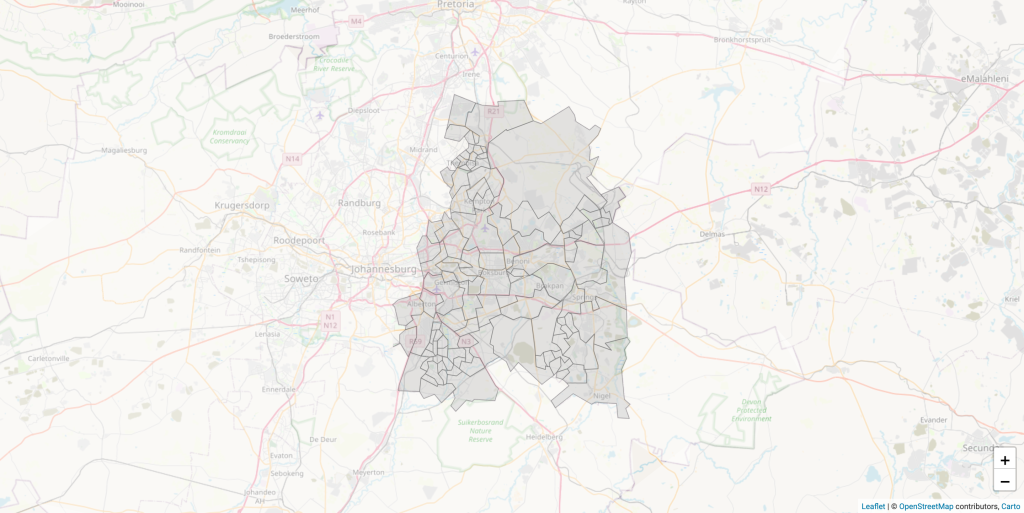
Source: Wazimap 2026.
Population
- 4,066,691
Source: Wikimap 2022.
The age distribution in South Africa
Age distribution shows how a population is divided across different age groups.
- 0-9: 15.1%
- 10-19: 13.7%
- 20-29: 19.9%
- 30-39: 21.2%
- 40-49: 13.7%
- 50-59: 8.3%
- 60-69: 5.2%
Source: Wazimap 2022.
City of Benoni, Ward 28
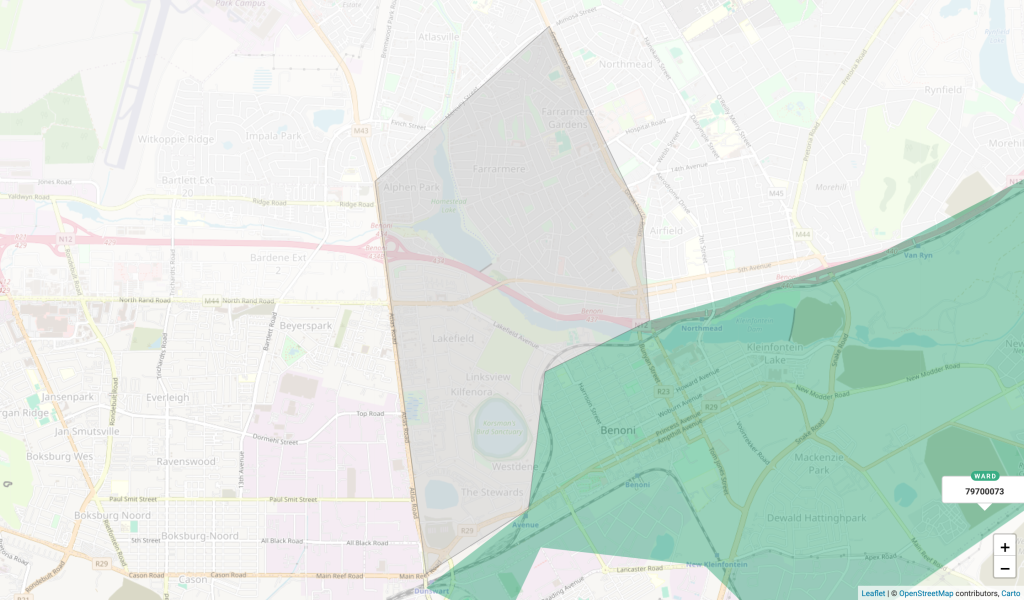
Source: Wazimap 2026.
- Suburbs: Farrarmere Gardens, Alphen Park, Lakefield,
Elections
- Registered voters: 12546
- Voter turnout: 70.2%
- Results:
- DA: 76.45%
- ANC: 7.41%
- VF+: 4.35%
Median Age
- 37
Age distribution
- 0-9: 13%
- 10-19: 13%
- 20-29: 14%
- 30-39: 15%
- 40-49: 16%
- 50-59: 13%
- 60-69: 10%
- 70-79: 5%
- 80+: 2%
Population
- 19538
Ethnicity
- Black African: 13%
Coloured: 1%
Indian or Asian: 17%
Other: 1%
Unspecified: 0%
White: 67%
Language
- English: 67%
- Afrikaans: 22%
- IsiZulu: 2%
- Other: 2%
- Sesotho: 1%
- Sepedi: 1%
“Employment
- 73.3%
Households
- 6657
Fully owned homes
- 65.5%
Women as head
- 31%
Average Annual Income
- R230 700
Source: Wazimap 2011.
City of Benoni, Ward 27
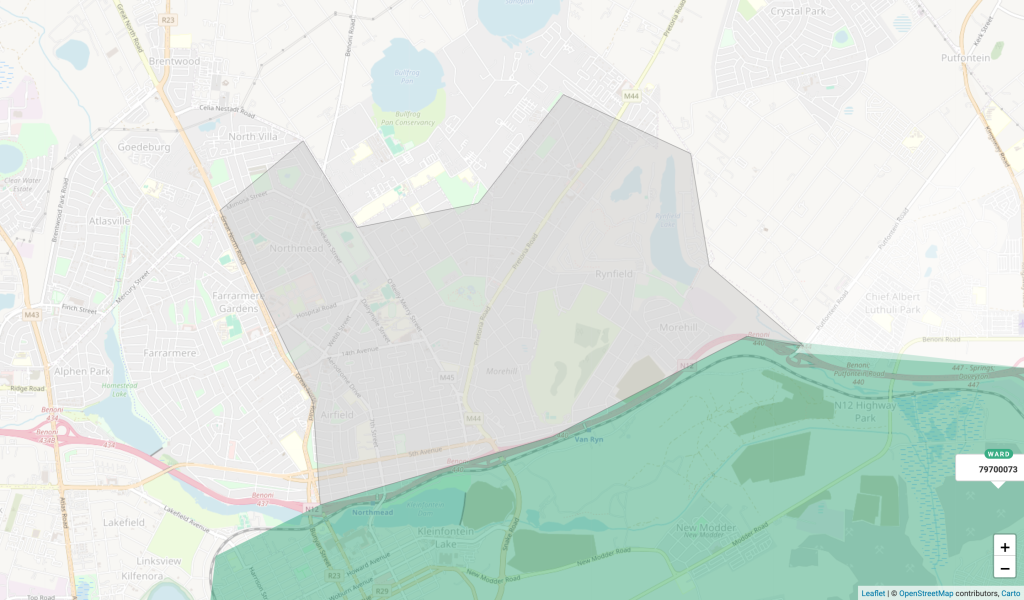
Source: Wazimap 2026.
- Suburbs: Airfield, Northmead, Rynfield, Morehill
Elections
- Registered voters: 16250
- Voter turnout: 72.4%
- results:
- DA: 83.83%
- VF+: 4.88%
- ANC: 3.18%
Median age
- 37
Age distribution
- 0-9: 12%
- 10-19: 14%
- 20-29: 13%
- 30-39: 14%
- 40-49: 17%
- 50-59: 13%
- 60-69: 9%
- 70-79: 5%
- 80+: 2%
Population
- 23858
Ethnicity
- Black African: 13%
- Coloured: 1%
- Indian or Asian: 4%
- Other: 1%
- Unspecified: 0%
- White: 81%
Language
- English: 55%
- Afrikaans: 34%
- IsiZulu: 2%
- Other: 2%
- Sesotho: 1%
- Sepedi: 1%
Employment
- 72.1%
Households
- 7533
Fully owned homes
- 67%
Women as head
- 30.6%
Average annual income
- R230 700
Source: Wazimap 2011.